Truth Talks are apart of the TruthGroup which also owns the fast growing censor social media platform, Truthbook.social

Categories
State Of Affairs

Who Controls America?

Who Controls America?

By LauraAboli

An excellent documentary that looks at the means and methods used by the ruling elites to gain total control.

False flag after false flag, they have manipulated the public to support endless wars that allowed them to gain further control.

If you open your eyes, you will realise they are still using the same problem/reaction/solution techniques.

This is a 2-hour documentary worth watching.

Let us not be fooled anymore!

Click Here To Play the Video

Original source: https://t.me/LauraAbolichannel/35779

Categories
State Of Affairs

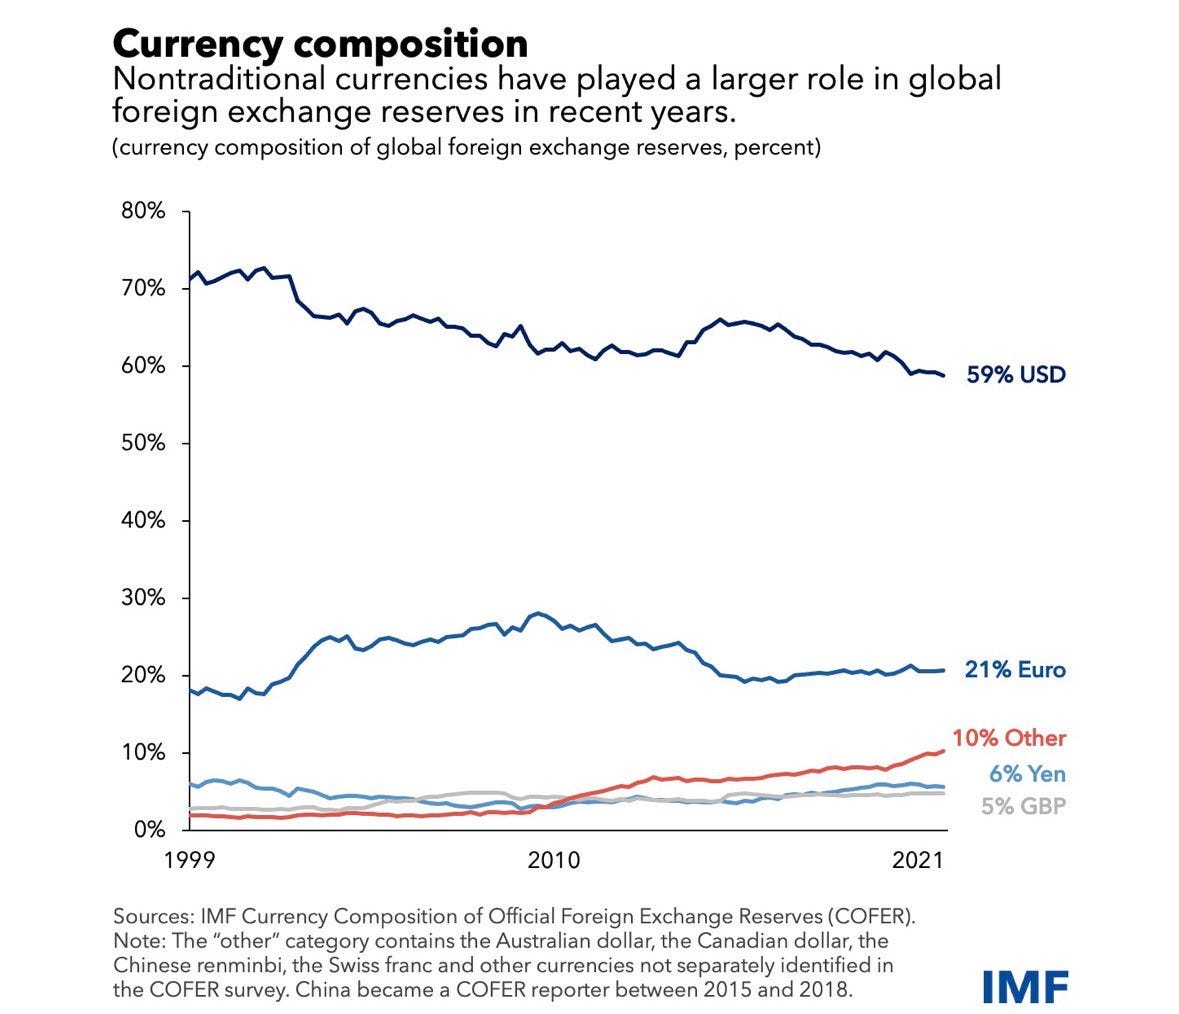
Association of Southeast Asian Nations Considers Dropping the US Dollar, Euro, Yen, and British Pound for Local Currency Financial Settlements… Elon Musk: “Serious Issue. US Policy has Been Too Heavy-handed, Making countries Want to Ditch the Dollar”

Association of Southeast Asian Nations Considers Dropping the US Dollar, Euro, Yen, and British Pound for Local Currency Financial Settlements… Elon Musk: “Serious Issue. US Policy has Been Too Heavy-handed, making countries Want to Ditch the Dollar”

By Investment Watch Blog

Elon Musk: “Serious issue. US policy has been too heavy-handed, making countries want to ditch the dollar.”

Original source: https://www.investmentwatchblog.com/association-of-southeast-asian-nations-considers-dropping-the-us-dollar-euro-yen-and-british-pound-for-local-currency-financial-settlements-elon-musk-serious-issue-us-policy-has-been-too-hea/

Categories
State Of Affairs

A Multipolar New World

A Multipolar New World

The role of America’s adversaries on the global stage is accelerating faster than ever. China, Russia, Saudi Arabia & others are all making moves away from the US-hegemonic system. What’s it mean?

What this means for the US dollar going forward…

We’ve seen several stories just in the past couple of weeks of America’s adversaries taking a larger role on the global stage. China brokered a peace deal with Saudi Arabia and Iran, Russia held a conference with 40+ African nations, Saudi Arabia is rumored to start accepting different currencies for oil transactions, and the list goes on. The world is rapidly changing. What does this mean for the United States – or more specifically, for our dollar?

As I’ve written in previous articles, much of America’s hegemony around the world relies heavily on the USD being the world reserve asset. Not only does our influence abroad rely on it, but our domestic economic policies do as well.

For decades, the world settled the vast majority of transactions in USD. This means if France buys oil from Saudi Arabia, they transact in USD. If Russia sells natural gas to China, they transact in USD. This system creates a huge demand for the US dollar. Since every country needs dollars to settle international transactions, they hold billions of US dollars in their central banks. This makes the US economy the most powerful system in the world – by far. We have the strongest currency, which gives us the strongest economy, which brings in more capital and investment into our markets and so on.

During the COVID pandemic, the US Federal Reserve printed trillions of dollars resulting in high inflation. But on a relative basis, not as high as many other countries, and certainly not as high if other countries printed the amount that we did. Our inflation was kept relatively low because of the worldwide demand for our dollar. In fact, we outsource a lot of our inflation when we print.

What if that all changed? What if our adversaries started to deal in their own currencies instead of our US dollars? Well, we’re starting to see that. In fact, this has been happening for decades, albeit slowly. This trend seems to be accelerating. Just yesterday, France bought natural gas from China and used the Chinese Yuan.

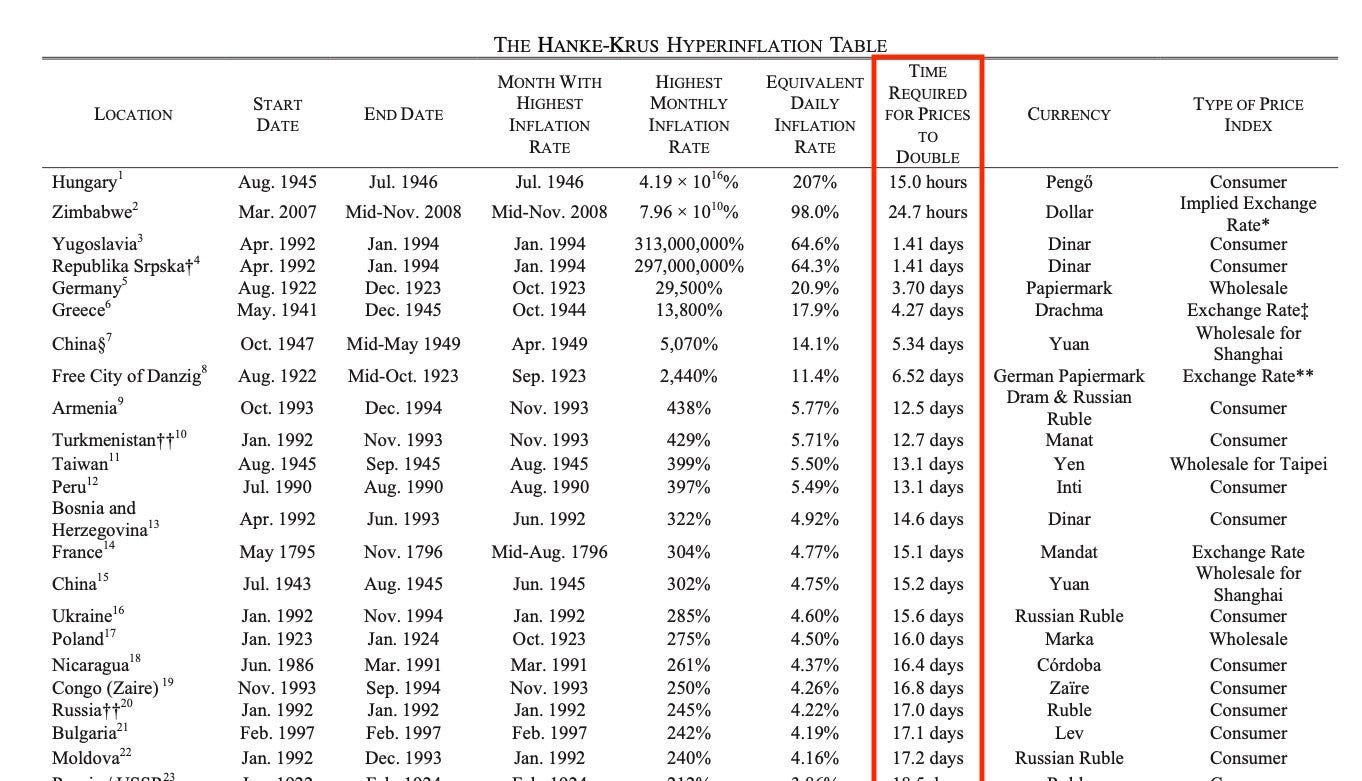
Will the dollar go from world reserve currency to the equivalent of the currency of Zimbabwe? No – or at least not for a very long time. However, this trend is something serious to watch as its implications could turn the world economy upside down. US power and influence could wane around the world, we could see heavy inflation, our asset markets nosedive overtime.

Image

If supply of USD keeps increasing (it will) and demand significantly drops off, we’re going to see massive economic troubles that we are not at all equipped for. There’s a lot of “unipolarists” out there who say this all means absolutely nothing. Does it? Russia was kicked off of the US-hegemonic system and is now arm-in-arm with countries like China and India. China is establishing close relations with Saudi Arabia and Iran.

So what? This all matters because Russia is the largest exporter of energy in the world. China is largest importer of energy in the world and the largest manufacturer. India has one of the largest growing populations in the world and a middle class that is quickly being established. Saudi Arabia is the largest exporter of oil in the world. These are all powerful economies of natural resources teaming up together while leaving the US out. What is America’s largest export? The dollar…

Image

This is why maintaining a diversified portfolio is extremely important going forward. Exposure to alternative investments, such as: energy, precious metals, cryptocurrency, real estate/land are the best way to hedge against this. We’ll continue to keep an eye on this trend and provide updates as major world events ramp up.

Resources:
https://t.me/intelslava/46359
https://t.co/FGAW01yMkD

Categories
Lifestyle

CDC Admits Autism Rates on the Rise

CDC Admits Autism Rates on the Rise

By Chris Black

Wow, I am shocked, they are finally admitting it.

I wonder what happened in recent years?

Can it be that back in 1980 there were seven required vaccinations to attend school and now there are over 30?

FYI, The CDC and FDA lost the court case linking vaccines to autism, where in court it became known that the two studies that the FDA used to prove no link actually did prove a higher rate of autism in vaccinated children.

Keep in mind, this is only US data.

The world has 8 billion people.

And they are still pushing this crap on children even…


Prevalence and Characteristics of Autism Spectrum Disorder Among Children Aged 8 Years — Autism and Developmental Disabilities Monitoring Network, 11 Sites, United States, 2020

Abstract

Problem/Condition: Autism spectrum disorder (ASD).

Period Covered: 2020.

Description of System: The Autism and Developmental Disabilities Monitoring (ADDM) Network is an active surveillance program that provides estimates of the prevalence of ASD among children aged 8 years. In 2020, there were 11 ADDM Network sites across the United States (Arizona, Arkansas, California, Georgia, Maryland, Minnesota, Missouri, New Jersey, Tennessee, Utah, and Wisconsin). To ascertain ASD among children aged 8 years, ADDM Network staff review and abstract developmental evaluations and records from community medical and educational service providers. A child met the case definition if their record documented 1) an ASD diagnostic statement in an evaluation, 2) a classification of ASD in special education, or 3) an ASD International Classification of Diseases (ICD) code.

Results: For 2020, across all 11 ADDM sites, ASD prevalence per 1,000 children aged 8 years ranged from 23.1 in Maryland to 44.9 in California. The overall ASD prevalence was 27.6 per 1,000 (one in 36) children aged 8 years and was 3.8 times as prevalent among boys as among girls (43.0 versus 11.4). Overall, ASD prevalence was lower among non-Hispanic White children (24.3) and children of two or more races (22.9) than among non-Hispanic Black or African American (Black), Hispanic, and non-Hispanic Asian or Pacific Islander (A/PI) children (29.3, 31.6, and 33.4 respectively). ASD prevalence among non-Hispanic American Indian or Alaska Native (AI/AN) children (26.5) was similar to that of other racial and ethnic groups. ASD prevalence was associated with lower household income at three sites, with no association at the other sites.

Across sites, the ASD prevalence per 1,000 children aged 8 years based exclusively on documented ASD diagnostic statements was 20.6 (range = 17.1 in Wisconsin to 35.4 in California). Of the 6,245 children who met the ASD case definition, 74.7% had a documented diagnostic statement of ASD, 65.2% had a documented ASD special education classification, 71.6% had a documented ASD ICD code, and 37.4% had all three types of ASD indicators. The median age of earliest known ASD diagnosis was 49 months and ranged from 36 months in California to 59 months in Minnesota.

Among the 4,165 (66.7%) children with ASD with information on cognitive ability, 37.9% were classified as having an intellectual disability. Intellectual disability was present among 50.8% of Black, 41.5% of A/PI, 37.8% of two or more races, 34.9% of Hispanic, 34.8% of AI/AN, and 31.8% of White children with ASD. Overall, children with intellectual disability had earlier median ages of ASD diagnosis (43 months) than those without intellectual disability (53 months).

Interpretation: For 2020, one in 36 children aged 8 years (approximately 4% of boys and 1% of girls) was estimated to have ASD. These estimates are higher than previous ADDM Network estimates during 2000–2018. For the first time among children aged 8 years, the prevalence of ASD was lower among White children than among other racial and ethnic groups, reversing the direction of racial and ethnic differences in ASD prevalence observed in the past. Black children with ASD were still more likely than White children with ASD to have a co-occurring intellectual disability.

Public Health Action: The continued increase among children identified with ASD, particularly among non-White children and girls, highlights the need for enhanced infrastructure to provide equitable diagnostic, treatment, and support services for all children with ASD. Similar to previous reporting periods, findings varied considerably across network sites, indicating the need for additional research to understand the nature of such differences and potentially apply successful identification strategies across states.

Introduction

Autism spectrum disorder (ASD) is a developmental disability characterized by persistent impairments in social interaction and the presence of restricted, repetitive patterns of behaviors, interests, or activities (1) that can cause a wide array of difficulties in social interaction, communication, and participation in daily activities. CDC began monitoring the prevalence of ASD in metropolitan Atlanta, Georgia, in 1996 as part of its Metropolitan Atlanta Developmental Disabilities Surveillance Program (2). CDC established the Autism and Developmental Disabilities Monitoring (ADDM) Network in 2000 and used the model developed in metropolitan Atlanta to track ASD prevalence in additional areas of the country. Starting with the 2000 surveillance year, the ADDM Network has reported ASD prevalence for even-numbered years (312). This is the 11th surveillance summary published in MMWR and marks a period of 20 years of monitoring ASD in multiple U.S. communities.

During the past two decades, ASD prevalence estimates of children aged 8 years from the ADDM Network have increased markedly, from 6.7 (one in 150) per 1,000 in 2000 to 23.0 (one in 44) in 2018 (3,12). In addition, overall ASD prevalence among White children was 50% higher than among Black or African American (Black) or Hispanic children in earlier years. (Persons of Hispanic origin might be of any race but are categorized as Hispanic; all racial groups are non-Hispanic). These gaps narrowed over time until ASD prevalence among Black and Hispanic matched prevalence among White children for the first time in 2016 and 2018, respectively (11,12). Similarly, robust associations between autism prevalence and higher socioeconomic status were observed in ADDM Network sites during 2002–2010 (13); however, this association was much more variable in 2018 (12). These patterns have largely been interpreted as improvements in more equitable identification of ASD, particularly for children in groups that have less access or face greater barriers in obtaining services (including diagnostic evaluations). However, consistent disparities for co-occurring intellectual disability exist because among all children with ASD, Black children have the largest proportion identified with intellectual disability (1012).

This report describes ASD prevalence and characteristics among children aged 8 years from 11 ADDM Network sites in 2020, including prevalence by site and demographic characteristics, median ages when children with ASD were first evaluated or identified, and the co-occurrence of intellectual disability. These data can be used by service providers, educators, communities, researchers, and policymakers to track trends and support efforts to ensure the equitable allocation of needed services and support for all children with ASD.

Methods

Surveillance Sites and Procedures

For 2020, the ADDM Network included 11 sites (Arizona, Arkansas, California, Georgia, Maryland, Minnesota, Missouri, New Jersey, Tennessee, Utah, and Wisconsin) that monitored ASD prevalence. Each site selected a geographic area of its state to monitor ASD among children aged 8 years (Table 1). Children included in this report were born in 2012 and lived in surveillance areas of the 11 sites during 2020. Sites were competitively funded and functioned as public health authorities under the Health Insurance Portability and Accountability Act of 1996 Privacy Rule and met applicable local institutional review board, privacy, and confidentiality requirements under 45 CFR 46 (14).

Case Ascertainment and Surveillance Case Definition

The ADDM Network conducts active surveillance of ASD by using multiple sources of information within a community (Table 1). The methods for collecting information and the case definition were unchanged from the 2018 surveillance year (12) and were modeled after those developed by CDC’s Metropolitan Atlanta Developmental Disabilities Surveillance Program (3). Sites request records from community medical, education, and service providers containing specific billing codes from the International Classification of Diseases, Ninth Revision (ICD-9) or International Classification of Diseases, Tenth Revision (ICD-10) or special education classification. The protocol allowed each site to select the ICD codes that necessitate record review if those codes closely aligned with program-recommended ICD codes (11). All ADDM Network sites used records from medical service providers that evaluated children with developmental disabilities and, for the first time, all sites had at least partial access to public school education records (Table 1). ADDM Network sites received information (including demographic data and ICD codes or special education classifications) for children with one or more of the requested codes or classifications, and ADDM staff manually reviewed the contents of associated (electronic and paper-based) records when available. If any part of the child’s record contained information meeting the case definition, ADDM staff abstracted information from the child’s developmental evaluations, special education plans, and other documents (e.g., cognitive or IQ tests) from all data sources. At certain sites, full record review could not be completed for all records because of the COVID-19 pandemic or other restrictions on physically accessing the location where records were stored (Table 1).

Children met the ASD case definition if they were aged 8 years in 2020 (born in 2012), lived in the surveillance area for at least 1 day during 2020, and had documentation in their records that they ever received 1) a written ASD diagnostic statement from a qualified professional, 2) a special education classification of autism (either primary exceptionality of ASD or an evaluation reporting criterion for autism eligibility was met) in public school, or 3) an ASD ICD code (ICD-9 codes between 299.00 and 299.99 or ICD-10 codes in the F84 range except for F84.2, Rett syndrome) obtained from administrative or billing information. Five children had an ICD code for Rett syndrome (F84.2) and no other indicators of ASD and did not meet the ASD case definition. ASD-related diagnostic conclusions (including suspected ASD or ruled out ASD) were collected verbatim from evaluations and were reviewed and classified by ADDM Network staff with clinical expertise at each site.

Additional Data Sources and Variable Definitions

Population denominators were obtained from the U.S. Census vintage 2021 county-level single-year-of-age postcensal population estimates for 2020 (15). In this report, the Asian and Native Hawaiian or other Pacific Islander categories were combined into Asian or Pacific Islander because current systems often combine these categories or are not explicit whether “Asian” at a given data source includes “Native Hawaiian or other Pacific Islander.” Population denominators include categories for American Indian or Alaska Native (AI/AN), Asian or Pacific Islander (A/PI), Black, White, two or more races, and Hispanic ethnicity. In previous ADDM Network reports, the denominator data were based on the National Center for Health Statistics postcensal bridged race estimates (also produced by the Census Bureau) (16); the bridged race data set did not include a category for two or more races, which increased counts in the other categories.

Surveillance areas at three sites (Arizona, California, and Minnesota) comprised subcounty school districts. For these sites, county population estimates were adjusted using the National Center for Education Statistics public school enrollment counts and the American Community Survey tract-level ages 5–9 years population estimates described previously (12). The primary race and ethnicity and sex information came from medical or education records and, when missing, was augmented by birth certificate linkages (among children born in the state of their residence at age 8 years), administrative, or billing information. Children with missing or unknown race or ethnicity information were excluded from race- and ethnicity-specific prevalence estimates.

Census tract-level median household income (MHI) was measured using the 2020 American Community Survey 5-year estimates (17). Population counts of children aged 8 years were estimated by dividing the number of children aged 5–9 years by five for each census tract. The tracts included in the surveillance areas were classified into three approximately equal-sized population groups (i.e., tertiles) of low, medium, and high MHI by using data from all sites. Children meeting the ADDM Network case definition for ASD were geocoded and assigned to a socioeconomic status (SES) group corresponding to their 2020 address. Census tract information was available for 96.0% of children; the remainder could not be linked to a census tract but had service receipt or school attendance that indicated study area residence.

A child was classified as having intellectual disability if they had an IQ score ≤70 on their most recent cognitive test or intellectual disability was indicated in a statement in a developmental evaluation from a qualified professional. Children were classified in the borderline range for IQ if the score on their most recent test was 71–85, and in the average or higher range with most recent IQ score >85 or with a statement their IQ was in the average range without a specific score. Age at first developmental evaluation was limited to children with information on the earliest collected or historically reported evaluation. Age at first ASD diagnosis was based on the earliest documented age when a qualified professional diagnosed ASD.

Analytic Methods

Prevalence was calculated as the number of children with ASD per 1,000 children in the defined population or group. Overall ASD prevalence estimates included all children with ASD from all 11 sites. Prevalence also was stratified by sex and by race and ethnicity using both the U.S. Census postcensal population estimates as well as the National Center for Health Statistics postcensal bridged race denominators. The Wilson score method was used to calculate 95% CIs. Pearson chi-square tests were used to compare proportions, and the Mantel-Haenszel (Woolf) test of homogeneity compared prevalence ratios across sites. Permutation tests were conducted to test differences in medians. Cochran Armitage tests were used to detect trends in prevalence across SES tertiles. Prevalence estimates with a relative SE >30% (and ratios calculated from those estimates) were considered to have limited statistical precision and were suppressed. Statistical tests with p values <0.05 and prevalence ratio 95% CIs that excluded 1.0 were considered statistically significant. R software (version 4.2; R Foundation) and additional packages were used to conduct analyses (12).

Results

ASD Prevalence

The overall ASD prevalence per 1,000 children aged 8 years was 27.6 (one in 36) and ranged from 23.1 in Maryland to 44.9 in California (Table 2). The overall male-to-female prevalence ratio was 3.8, with overall ASD prevalence of 43.0 among boys and 11.4 among girls. The same sites conducted ASD surveillance in 2018 and reported a combined prevalence of 23.0; however, certain sites changed their geographic areas or access to data sources for the current reporting period (Supplementary Table 1, https://stacks.cdc.gov/view/cdc/124397). The two sites with the largest relative changes (Missouri [48.5%] and Wisconsin [49.5%]) from 2018 to 2020 had increased access to education records in 2020 but no change in the geographic areas.

Overall, ASD prevalence per 1,000 children aged 8 years differed by racial and ethnic groups (Table 3); prevalence among White children (24.3) was lower than prevalence among Black, Hispanic, or A/PI children (29.3, 31.6, and 33.4, respectively). Among AI/AN children, ASD prevalence was 26.5 overall and was similar to other groups, but estimates met the 30% relative SE threshold for statistical precision in just one site (Arizona). ASD prevalence among children of two or more races was 22.9, which was not different than among White children but was lower than prevalence among AP/I, Black, and Hispanic children. Missouri was the only site in which White children had higher ASD prevalence than another racial or ethnic group (White compared with two or more races). Additional prevalence ratios comparing racial and ethnic groups are available (Supplementary Table 2, https://stacks.cdc.gov/view/cdc/124397). Prevalence calculations using the bridged-race denominator racial and ethnic categories used in previous reports (Supplementary Table 3, https://stacks.cdc.gov/view/cdc/124397) yielded similar findings of lower ASD prevalence among White children compared with that among Asian, Black, and Hispanic children.

In eight sites, ASD prevalence was not associated with census tract-level MHI, but in three sites (Arizona, New Jersey, and Utah), lower ASD prevalence was observed among children living in census tracts with higher MHI (Figure 1). When all sites were combined, prevalence of ASD was lower among census tracts with higher MHI; however, ASD prevalences for the low, medium, and high SES tertiles were all between 23.0–27.2.

ASD Identification

The percentage of children with diagnostic statements, special education classifications, and ICD codes varied by site (Table 4). Across sites, the percentage of children with ASD who had a documented ASD diagnostic statement was 74.7% overall (range = 60.9% in Wisconsin to 94.7% in New Jersey). ASD prevalence per 1,000 children aged 8 years based exclusively on documented ASD diagnostic statements was 20.6 overall (range = 17.1 in Wisconsin to 35.4 in California) (Figure 2). The overall percentage of children with ASD who had a documented ASD special education classification was 65.2% (range = 44.9% in Utah to 84.9% in Minnesota) (Table 4). The percentage of children with ASD who had a documented ICD code was 71.6% (range = 51.9% in Minnesota to 82.7% in California). A majority of (74.2%) children with ASD had at least two of the three types of ASD identification documented in their records (i.e., ASD diagnostic statement, special education classification, and ASD ICD code) and 37.4% had all three (Figure 3). A majority of children with an ICD code (89.5% of 4,472 children) also had a documented ASD diagnostic statement or ASD special education classification; among all children with ASD, few (7.5% of 6,245 children) met the case definition through having an ICD code only. A majority of children with documents indicating an ASD diagnosis or ASD special education classification had these mentioned multiple times in their records (overall median number of diagnoses documented: two; range: one in Tennessee to six in New Jersey; overall median special education classifications documented: four, site-specific medians ranging from two in Wisconsin and Tennessee to six in California) (Supplementary Table 4, https://stacks.cdc.gov/view/cdc/124397).

Among children with ASD, 37.4% ever had an evaluation report noting that ASD was suspected but not confirmed (Table 4). Overall, 11.6% of children with ASD had an ASD diagnosis or special education eligibility ruled out (range = 4.3% in Georgia to 29.3% in California). For a majority of children, ASD was confirmed after ASD had previously been ruled out; however, 3.9% (range = 0.2% in New Jersey to 12.8% in California) of all children with ASD had an evaluation ruling out ASD more recently than one confirming ASD.

Cognitive Ability Among Children with ASD

Data on cognitive ability were available for 4,165 (66.7%) children aged 8 years with ASD (range: 39.7% in Wisconsin to 91.2% in Arkansas) (Table 5). Among children with data on cognitive ability, the median age of the most recent cognitive test or examiner impression was 67 months (interquartile range: 51–81 months) (Supplementary Table 5, https://stacks.cdc.gov/view/cdc/124397). Girls with ASD were less likely than boys with ASD to have data on cognitive ability (64.4% versus 67.3%). Similar percentages of Black and White children had data on cognitive ability (66.8% and 65.0%, respectively), but Hispanic children (68.8%) were more likely to have cognitive data than White children. AI/AN (79.3%) and A/PI (71.2%) children and those of two or more races (73.9%) all had cognitive data at least as often as the other groups.

Among children aged 8 years with ASD who had data on cognitive ability, 37.9% were classified as having intellectual disability at their most recent test or examination, 23.5% were classified in the borderline range (IQ 71–85), and 38.6% were classified in the average or higher range (IQ >85) (Table 5). The percentage of children classified as having intellectual disability varied widely among sites (range = 21.7% in California to 51.0% in Tennessee). The median age of most recent test also varied by site (range = 55 months in Wisconsin to 79 months in Arizona) (Supplementary Table 5, https://stacks.cdc.gov/view/cdc/124397). Overall, girls with ASD were more likely to be classified as having an intellectual disability than boys with ASD (42.1% versus 36.9%), and Black children were more likely than Hispanic and White children to be classified as having intellectual disability (50.8%, 34.9%, and 31.8%, respectively). The percentage of children with ASD and intellectual disability among A/PI, two or more races, or AI/AN children was 41.3%, 37.8%, and 34.8%, respectively.

Age at First Evaluation and ASD Diagnosis

Among 5,744 children aged 8 years with ASD and recorded evaluations, 49% were evaluated by age 36 months (range = 38.5% in Utah to 59.5% in Maryland) (Table 6). The median age at first recorded evaluation ranged from 32 months in California to 44 months in Utah. Children with ASD with an intellectual disability were more likely to be evaluated by age 36 months compared with children with ASD without an intellectual disability (61.8% versus 46.0%).

Among the 4,663 children aged 8 years with ASD who had an evaluation containing an ASD diagnostic statement, the median age at earliest known diagnosis was 49 months (range = 36 months in California to 59 months in Minnesota) (Table 7). Children with ASD and intellectual disability had a lower median age at diagnosis (43 months) than children without an intellectual disability (53 months). When special education classifications of autism were considered with ASD diagnoses for earliest identification, 5,579 children with ASD were identified with a median age of 52 months (range = 39 months in California and New Jersey to 60 months in Arizona).

Discussion

For 2020, the prevalence estimate of ASD per 1,000 children aged 8 years was 27.6 (range: 23.1 in Maryland to 44.9 in California), which is higher than previous estimates from the ADDM Network. For the first time, the overall ASD prevalence for girls was >1% (11.4); in contrast, the prevalence among boys had already been noted to be higher (11.5) in the first ADDM Network report in 2002 (4). The continued variability in prevalence across ADDM sites, as well as the shifting in differences between demographic groups, highlight an ongoing need to better understand the systems and practices that contribute to this variability.

In its earliest years, the ADDM Network consistently reported lower overall ASD prevalence among Black and Hispanic versus White children aged 8 years. The White-Black gap in ASD prevalence narrowed in 2014, and there was no overall difference in ASD prevalence in 2016 or 2018 (Supplementary Figure 1, https://stacks.cdc.gov/view/cdc/124397). ASD prevalence among Asian, Black, and Hispanic children was at least 30% higher in 2020 than 2018, and ASD prevalence among White children was 14.6% higher than in 2018. Although this was the first time the ADDM Network reported lower ASD prevalence among White children than among other groups for children aged 8 years, a similar pattern was observed among children aged 4 years in 2018 (18). In addition, similar patterns were reported in analyses of national special education data and of California Developmental Services data, illustrating the prevalence of ASD classifications among Black and Hispanic children catching up and eclipsing that of White children over time (19,20). These patterns might reflect improved screening, awareness, and access to services among historically underserved groups. ASD prevalence in 2020 also was associated with lower SES, the opposite of what was observed previously (13), further supporting progress in identifying children regardless of race and ethnic group. As evidence grows of increased access to identification, attention might shift to what factors, such as social determinants of health, could lead to higher rates of disability among certain populations.

Even with higher ASD prevalence among Black compared with White children, Black children with ASD remained more likely to have co-occurring intellectual disability than White children, a finding that has been observed over multiple ADDM Network surveillance reports and among Black compared with White children without ASD in the United States (21). If Black children with ASD have less access to services than White children with ASD, as has been previously reported, the disproportionality in co-occurring intellectual disability might indicate an underascertainment of ASD among Black children without intellectual disability. Continued monitoring of trends is warranted, and it might be appropriate to re-examine potential risk or protective factors that were previously studied when the demographic composition of ASD was different.

During this period of changing demographic differences in ASD prevalence, the ADDM Network implemented two methodological changes. First, a new ASD case definition was adopted for the 2018 surveillance year. The previous case definition relied on reviewing written descriptions of ASD symptoms that were documented in comprehensive developmental evaluations. It could classify children without any formal ASD identification as ASD cases and could exclude children who had ASD diagnosed but lacked sufficient corroborating details in their records. An analysis found that non-White children were more likely to have incomplete records, which could lead to underascertainment of ASD compared with White children (22). However, a retroactive application of the current case definition to the 2014 and 2016 surveillance years indicates similar prevalence ratios by race and ethnicity as the previous case definition (23). The second change, implemented in 2020, is using population denominators with standardized racial and ethnic categories. The most important difference from the previous (bridged-race) denominators is the inclusion of a category for two or more races, which reduces the size of the denominators among the other racial groups. Nevertheless, prevalence estimates based on the previous bridged-race denominators produced a similar pattern of lower ASD prevalence among White children compared with the other groups (Supplementary Table 3, https://stacks.cdc.gov/view/cdc/124397). Thus, there were qualitatively similar patterns when consistent case definitions and denominator data sets were applied during 2014–2020.

Although ASD can be identified by age 1 year in certain cases (24,25), as described in this report, a majority of children aged 8 years living in ADDM communities were not identified until they were several years older. The reported median age of identification has not changed much over the years of ADDM Network surveillance, but it does not necessarily indicate a lack of progress in community early identification efforts. In a recent analysis of ADDM Network data during 2002–2016, the median age of diagnosis might mask progress in early detection if more children are identified (i.e., prevalence increases) at all ages and does not include children who might have ASD diagnosed after age 8 years (26,27). Therefore, the ADDM Network now reports the cumulative incidence of ASD by age 48 months as a measure of early identification and compares children aged 4 years and 8 years living in the same communities as a measure of progress (28,29). The 2020 report on early identification of ASD found more children were identified at early ages than in the past, but many are still not identified until they are school-aged (30).

CDC maintains a list of peer-reviewed autism prevalence studies with similar metrics to ADDM surveillance reports (https://www.cdc.gov/ncbddd/autism/data/autism-data-table.html). Other federal programs reporting ASD prevalence information in the United States include the National Survey for Children’s Health (NSCH) and the National Health Interview Survey. The ASD prevalence estimate based on the 2020 and 2021 NSCH was 2.9% and the 95% CI (2.7%–3.1%) included the 2020 ADDM Network ASD prevalence estimate (2.76%) (31). These surveys aim to produce nationally representative estimates among children aged 3–17 years old and ascertain information about ASD through parental report, whereas the ADDM Network estimates are not intended to be nationally representative and are generated from empirical data collected from multiple sources among participating communities. The active surveillance approach used by the ADDM Network allows reporting of when and where children are identified with ASD and affords comparisons between and within diverse U.S. communities and is not dependent on parental survey participation and ASD reporting. To facilitate comparisons between different data sources, CDC maintains an interactive website that presents U.S. state-based ASD prevalence data from four data systems (ADDM Network, NSCH, Medicaid, and special education) (https://www.cdc.gov/ncbddd/autism/data/index.html).

Limitations

The findings in this report are subject to at least seven limitations. First, the methods rely on the availability, quality, and completeness of existing information and records to ascertain ASD cases and other indicators. Although all sites had access to special education classification data, certain sites did not have access to education records for their entire population, limiting the ability to identify children with ASD exclusively identified and served through their schools. Sites requested records from public school special education programs but did not review private school education records. Incomplete information could lead to misclassifying children’s cognitive ability, overestimating the age when they were first evaluated or when ASD was diagnosed, or failing to ascertain that the children were identified as having ASD. Sex information reflects what is represented in children’s records and might not reflect their gender identity. Second, the case definition for intellectual disability was measured using a child’s latest cognitive test or examiner statement of a child’s cognitive ability. Diagnostic and special education eligibility criteria for intellectual disability requires concurrent adaptive functioning deficits (32). IQ scores are not necessarily stable measures of intellectual ability over time, can increase among children with ASD in response to intensive early therapeutic interventions (33), and might be unstable during early childhood (34). The age at which children had their most recent test or examiner impression of cognitive ability varied by site. Third, the ADDM Network sites are not intended to be representative of the states in which the sites are located. ADDM Network sites are selected through an objective and competitive process, and findings do not necessarily generalize to all children aged 8 years in the United States. Interpretations of temporal trends can be complicated by changing surveillance areas, case definitions, data source access, and diagnostic practices. Fourth, small numbers result in imprecise estimates for certain sites and subgroups, and estimates falling below the selected threshold for statistical precision were suppressed. Fifth, the surveillance data system does not collect the number of ASD ICD codes a child received at a specific source, limiting comparability to analyses of claims/billing databases that consider number of ICD codes received. Sixth, the COVID–19 pandemic resulted in reduced access to records from some sources at certain sites; it was often possible to electronically obtain some data elements from these sources but not manually review the full contents of records. Disruptions in services and school closures during 2020 might have resulted in less documentation of ASD in records, which could decrease ASD ascertainment by ADDM sites. Finally, the prevalence of undetected ASD in each community as well as false-positive ASD diagnoses and classifications are unknown.

Future Directions

For the 2022 and 2024 surveillance years, the ADDM Network will continue to monitor ASD prevalence among children aged 8 years; progress in early ASD identification among children aged 4 years; and the health status of, needs of, and planning for adolescents with ASD as they prepare to transition to adulthood. The 2020 early identification ADDM Network report documents the impact of the COVID-19 pandemic on early evaluation and detection of ASD; the effects of the pandemic on ASD identification also will be examined among children aged 4 and 8 years in future years of surveillance. Additional analyses are needed to better understand changing patterns in ASD prevalence and differences between groups; for example, changes between 2010 (when higher income was associated with higher ASD prevalence) to the present findings of higher prevalence among lower-SES neighborhoods are comparable to studies from France and Sweden (35,36). In the future, it might be possible to link the Social Vulnerability Index to children ascertained through the ADDM Network to better describe disparities within communities.

Conclusion

Findings from the ADDM Network 2020 surveillance year indicate higher ASD prevalence than previous estimates from the ADDM Network and continuing evidence of a marked shift in the demographic composition of children identified with ASD compared with previous years. Although earlier ADDM Network reports have shown higher prevalence among higher-SES White children compared with other groups, the latest data indicate consistently higher prevalence among Black and Hispanic children compared with White children, and no consistent association between ASD and SES. Furthermore, this is the first ADDM Network report in which the prevalence of ASD among girls has exceeded 1%. Since 2000, the prevalence of ASD has increased steadily among all groups, but during 2018–2020, the increases were greater for Black and Hispanic children than for White children. These data indicate that ASD is common across all groups of children and underscore the considerable need for equitable and accessible screening, services, and supports for all children.

Resources:
https://www.investmentwatchblog.com/cdc-admits-autism-rates-on-the-rise/
https://www.globaldiasporanews.com/prevalence-and-characteristics-of-autism-spectrum-disorder-among-children-aged-8-years-autism-and-developmental-disabilities-monitoring-network-11-sites-united-states-2020/

Categories
State Of Affairs

Forget the Global Collapse. Be Mad at Trump and Putin Instead

Forget the Global Collapse. Be Mad at Trump and Putin Instead

By Marie Hawthorne

Oh, the Ides of March.  Julius Caesar was killed on March 15, over 2000 years ago.  On March 17 this year, an arrest warrant was issued for Russia’s Vladimir Putin, and on March 18, former President Trump announced that he expected to be arrested soon.  What is it about this time of year?

If you’re curious about Caesar, read Shakespeare’s play.  Or watch HBO’s Rome.

If you’re curious about Putin and Trump, read on.

The warrant for President Vladimir Putin

On March 17, the International Criminal Court issued an arrest warrant for Russia’s President Vladimir Putin.  The ICC claims that Putin has violated human rights by illegally transferring children from occupied parts of Ukraine to Russia.

So, what does this mean, exactly?  If the ICC issues an arrest warrant, who goes and grabs Putin and puts him in jail?

The arrest warrant is symbolic.  The ICC doesn’t have its own police force, which means that they rely on the law enforcement agencies of its 123 member nations to carry out the arrests they want.  Russia has never been part of the ICC; neither has the United States or China.  Ireland, Croatia, Austria, and Germany have said that they will carry out the arrest if Putin comes to their countries.

His travel within Europe might be a little more restricted, but that will probably be the only way in which Putin is affected.

And even some of the ICC signatories have proven unwilling to carry out the arrest.  South Africa, for example, still plans to host Putin for the 2023 BRICS (Brazil, Russia, India, China, South Africa) Summit.  South Africa has refused to condemn the war in Ukraine, and government leaders say that they’re looking at all options right now. Hungary has said that they will not arrest Putin. The UK and France, like South Africa, aren’t making any commitments.

The Russians are angry, though.  Shortly after the ICC issued its warrant, former Russian President Dmitry Medvedev threatened the judges that issued the warrant with missile strikes.

And while Putin likely won’t wind up in jail, his arrest warrant will make it difficult for him to travel to any individual country in Europe that may have wanted to negotiate with him.  Making individual peace treaties more difficult to discuss may be the biggest effect of this arrest warrant.

President Donald Trump is facing legal trouble too.

And Putin isn’t the only world leader with legal troubles at the moment.  Former President Trump began making claims on his Truth Social media account about getting arrested the week of March 20.   He said he expected to be arrested Tuesday, though that didn’t happen.

What’s this all about?  Well, the former stripper Stormy Daniels claimed she and Trump had an affair in 2006.  In 2016, when Trump first ran for president, she went to the press and made noise about it.  Trump has denied the affair since day one, but in 2016 his lawyer at the time, Michael Cohen, gave her $130,000 to sign a non-disclosure agreement.

Is this kind of scummy?  Sure, though, in my personal opinion, if Stormy had had any hard evidence, she would have gotten more than $130,000 out of him.  In 2016, Donald Trump had a net worth of $4.5 billion.  $130,000 isn’t even chump change for someone with that kind of money.  But I could be wrong.

More importantly, though it looks bad, it’s actually not illegal. And as professor and constitutional law expert Jonathan Turley explained on Fox last weekend, there are a multitude of reasons that the indictment probably won’t go anywhere, unless some totally new information comes to light.

A grand jury session had been assembled to vote on whether or not Trump would be indicted.  They were supposed to vote on whether or not the payment made to Stormy Daniels back in 2016 violated campaign finance laws.  However, on Wednesday, March 22, the jury session was called off with no apparent reason being given.

Why are these efforts to arrest controversial world leaders happening?

So, there are efforts being made to arrest Trump and Putin, two controversial world leaders widely hated by establishment figures but who enjoy a wide base of grassroots support nonetheless.

And I suppose I should make it clear that I don’t particularly like Trump or Putin.  I think the religiosity of both is a sham; I think they use it to manipulate voters and portray a certain image.  Putin, particularly, knows how bitterly Russians resented the Soviet crackdown on religion.  He knows how much the rest of the world is tired of Western leaders promoting values that don’t necessarily align with theirs.  Putin uses that resentment to his advantage, promoting himself as the defender of traditional values against the decadent Westerners.

This, of course, is pure political theater.

If you want details of how Russians and Ukrainians are treating each other, you can read the UN’s Report on the Human Rights Situation in Ukraine. Russian soldiers have been brutally beating up Greek Catholic and Protestant missionaries, telling them that only Orthodoxy is allowed.  However, when Zelensky bans not only Russian but also Ukrainian Orthodox Churches, repossesses church property, and expels clergy, of course, Putin uses it to prove his point.

Trump, likewise, is a master of self-aggrandizement in all its forms.

Having said that, both men are nationalists.  They are not team players. They want to rule their own respective countries and aren’t overly upset by what the international community thinks of them.

And that might be the real issue.

These arrest warrants and threats of criminal charges reek of desperation.  Trusted institutions, from the government to health to banking, have been losing their authority; the powers that be are desperate to fixate our minds on anything other than their own failures.

It’s not working.  People are asking inconvenient questions about the war in Ukraine, and indeed a few major Republican players, like Ron DeSantis, are openly questioning why Americans are hemorrhaging money we don’t have into what he called a “territorial dispute.”   Too many medical professionals have been coming forward with details of what went wrong during Covid.  With the largest bank failures since the 2008 financial crisis, global banking is a total mess right now.

American emperors are not the only ones being disrobed.  The Dutch political party representing those protesting farmers just won 15 out of 75 parliament seats, making it the largest party in the high chamber.  This was a party that didn’t exist five years ago.

Massive protests have forced transportation within Germany to grind to a halt.  Even though this has been hugely disruptive for the average German, a majority (55%) support the strikes.  Striking workers are demanding a 10.5% pay raise to help them deal with ever-increasing inflation.  The February overall inflation rate was 9.3%, though food prices were 21.8% higher and energy prices were 19.1% higher than the previous year.

Over a million people took part in French protests last week, some of which became violent.  The French have been protesting the government’s attempts to raise the retirement age.

Hundreds of thousands of Israelis have been protesting judicial reforms this week. As well  I feel obliged to point out that Yuval Noah Harari, Klaus Schwab’s right-hand man, has been giving speeches in favor of the protesters.  I really don’t understand Israeli politics well enough to say I support one side or another.

In Greece, tens of thousands of people have taken to the streets for weeks to protest the horrific train crash that killed 57 people, mostly students, and injured more than 80 others. Despite crippling high taxes, Greeks feel that neglect of the infrastructure was responsible for the disaster, and they are demanding accountability and justice for the victims.

My point is simply that people around the world are furious, and they’re starting to cause trouble.

The charges against Putin and Trump are redirection.

I think the charges being leveled against Putin and Trump are establishment attempts to channel people’s rage against figures whom it’s currently acceptable to hate.

The truth is, the reasons for the protests above are varied, and unless the quality of life starts improving for a lot of people really fast, it’s going to be hard getting that rage genie back in the bottle.

By “quality of life,” I don’t mean more stuff.  Americans have been getting overly distracted by cheap crap for years.  I don’t mean more “conveniences,” either.  Many people in the First World, while not about to freeze or starve, simply want more control in their day-to-day lives, whether it’s what their children are learning at school or if they have chicken or crickets for dinner.  People all over the world feel as though their ability to choose their own life journey is disappearing, and they are angry.

And many other people, some within the First World and more that are not are getting closer to freezing or starving.  They’re angry too.  It’s a big, ugly package.

So, what does this have to do with prepping?

Situational awareness is vital to prepping.  People have had varying degrees of pain over the past few years; if you’ve been blessed with a great deal of job security and flexible childcare arrangements, count your lucky stars.  And watch what’s going on near your neighborhood.  I hope I’m wrong; I might be.  But I also think it would be foolish to ignore the protests.

The political theater surrounding Trump and Putin is an attempt to distract from the worldwide rage bubbling just below the surface.  If you haven’t been paying attention to civil unrest in your area, I think now is a good time to start.

But what do you think? Why do you feel that these charges are being levied right now? Do you think they’re legitimate charges? Do you believe that there’s merit to them? Or do you think it’s a distraction? And if so, what are we being distracted from?

Original source: https://www.investmentwatchblog.com/forget-the-global-collapse-be-mad-at-trump-and-putin-instead/

Categories
Lifestyle

Eminent Oxford Scientist Says Wind Power “Fails On Every Count”

Eminent Oxford Scientist Says Wind Power “Fails On Every Count”

By TYLER DURDEN

It could be argued that the basic arithmetic showing wind power is an economic and societal disaster in the making should be clear to a bright primary school child. Now the Oxford University mathematician and physicist, researcher at CERN and Fellow of Keble College, Emeritus Professor Wade Allison has done the sums. The U.K. is facing the likelihood of a failure in the electricity supply, he concludes.

“Wind power fails on every count,” he says, adding that governments are ignoring “overwhelming evidence” of the inadequacies of wind power, “and resorting to bluster rather than reasoned analysis”.

Professor Allison’s dire warnings are contained in a short paper recently published by the Global Warming Policy Foundation. He notes that the energy provided by the Sun is “extremely weak”, which is why it was unable to provide the energy to sustain even a small global population before the Industrial Revolution with an acceptable standard of living. A similar point was made recently in more dramatic fashion by the nuclear physicist Dr. Wallace Manheimer. He argued that the infrastructure around wind and solar will not only fail, “but will cost trillions, trash large portions of the environment and be entirely unnecessary”.

In his paper, Allison concentrates on working out the numbers that lie behind the natural fluctuations in the wind. The full workings out are not complicated and can be assessed from the link above. He shows that at a wind speed of 20mph, the power produced by a wind turbine is 600 watts per square metre at full efficiency. To deliver the same power as the Hinkley Point C nuclear plant – 3,200 million watts – it would require 5.5 million square metres of turbine swept area.

It is noted that this should be quite unacceptable to those who care about birds and other environmentalists. Of course, this concern does not seem to have materialised to date. Millions of bats and birds are calculated to be slaughtered by onshore wind turbines every year. Meanwhile, off the coast of Massachusetts, work is about to start on a giant wind farm, complete with permits to harass and likely injure almost a tenth of the population of the rare North Atlantic Right whale.

When fluctuations in wind speed are taken into account in Allison’s formula, the performance of wind becomes very much worse. If the wind speed drops by half, the power available falls by a factor of eight. Almost worse, he notes, if the wind speed doubles, the power delivered goes up eight times, and the turbine has to be turned off for its own protection.

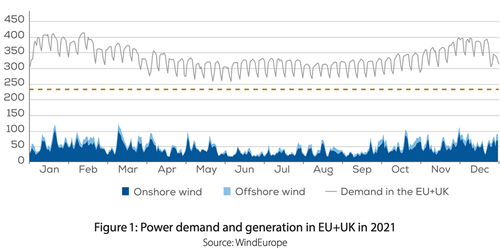
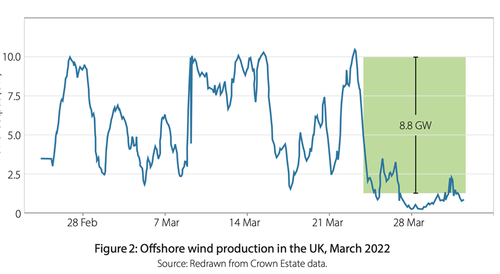
The effect of the enhanced fluctuations is dramatic, as shown in the graph above. The installed nominal generating capacity in the EU and U.K. in 2021, shown by the brown dashed line, was 236 GW, but the highest daily output was only 103 GW on March 26th. The unreliability is shown to even greater effect in the second graph that plots the wind generated offshore in the U.K. in March last year.

For eight days at the end of the month, power generation slumped, presumably, says Allison, because the wind speed halved. The 8.8 GW daily loss over the period was noted to be 1,000 times the capacity of the world largest grid storage battery at Moss Landings in California. When it comes to the enormous batteries needed to store renewable power, Allison notes the problems with safety, as well as mineral shortages. Batteries will never make good the failure of offshore wind farms, even for a week, and he points out they can fail for much longer than that.

Others have recently looked in more detail at the costs of battery storage. The American lawyer and mathematician Francis Menton, who runs the Manhattan Contrarian site, reviewed recent official cost reports and found that “even on the most optimistic assumptions” the cost could be as high as a country’s GDP. On less optimistic assumptions, the capital cost alone could be 15 times annual GDP. Last year, Associate Professor Simon Michaux warned the Finnish Government that there were not enough minerals in the world to supply all the batteries needed for Net Zero. Michaux observed that the Net Zero project may not go fully “as planned”. Meanwhile, Menton concluded, with an opinion that some might consider unduly charitable: “It is hard to avoid the conclusion that the people planning the Net Zero transition have no idea what they are doing.”

Professor Allison has done his sums based on basic physics and freely available information. “Whichever way you look at it, wind power is inadequate. It is intermittent and unreliable; it is exposed and vulnerable; it is weak with a short life-span,” he concludes.

Original source: https://www.zerohedge.com/political/eminent-oxford-scientist-says-wind-power-fails-every-count

Categories
State Of Affairs

Governance By Artificial Intelligence:The Ultimate Unaccountable Tyranny: The elites will Present AI as the Great adjudicator, the Pure and Logical Intercessor of the Correct Path; Not Just for Nations and For Populations at Large But for Each individual

Governance By Artificial Intelligence:The Ultimate Unaccountable Tyranny: The elites will Present AI as the Great adjudicator, the Pure and Logical Intercessor of the Correct Path; Not Just for Nations and For Populations at Large But for Each individual

By Brandon Smith

It’s no secret that globalist institutions are obsessed with Artificial Intelligence as some kind of technological prophecy. They treat it as if it is almost supernatural in its potential and often argue that every meaningful industrial and social innovation in the near future will owe its existence to AI. The World Economic Forum cites AI as the singular key to the rise of what they call the “Fourth Industrial Revolution.” In their view, there can be no human progress without the influence of AI algorithms, making human input almost obsolete.

This delusion is often promoted by globalist propagandists.  For example, take a look at the summarized vision of WEF member Yuval Harari, who actually believes that AI has creative ability that will replace human imagination and innovation.  Not only that, but Harari has consistently argued in the past that AI will run the world much better than human beings ever could.

Harari’s examples of AI creativity might sound like extreme naivety to many of us, but he knows exactly what he is doing in misrepresenting the capabilities of algorithms.  Games like chess and Go are games of patterns restricted by rules, there only so many permutations of these patterns in any given scenario and AI is simply faster at spotting them than most humans because that is what it is designed to do by software creators.  This is no different that solving a mathematical equation; just because a calculator is faster than you does not mean it is “creative.”

There is a big difference between cognitive automation and cognitive autonomy.  AI is purely automation; it will play the games it is programmed to play and will learn to play them well, but it will never have an epiphany one day and create a new and unique game from scratch unless it is coded to do so.  AI will never have fun playing this new game it made, or feel the joy of sharing that game with others, so why would it bother?  It will never seek to contribute to the world any more than it is pre-programmed to do.

The manner in which globalists hype AI is very tactical, however.  When Harari claims that many people will become part of the “useless class” once AI takes over the economy, he is hinting at another globalist ideology based on elitism – Transhumanism.  The goal of transhumanism is to one day merge human bodies and human minds with technology and AI, and only a limited group of people will have the resources to accomplish this (the globalists).

Are you afraid of becoming part of the “useless class”?  Well, if you scrape and beg and serve every whim of the elitist establishment then maybe you will be lucky enough to get implants which allow you to interface with AI, and then your future employment and “usefulness” will be secured.  Doesn’t that sound nice?

But, like all the visions of narcissists there are delusions of godhood and then there is reality.  I continue to have serious doubts that AI will ever be legitimately autonomous or legitimately beneficial to humanity in any way beyond having the ability to calculate quickly within mathematical rules. Speedy data analysis can be useful in many areas of science, but it’s not really proof of autonomous intelligence, and algorithms can be predictive but not any more predictive than human beings looking at the same statistical data. There is nothing about AI that is impressive when one considers what little it actually accomplishes.

AI is a toy, a parlor trick, not a living entity with independent observations and conclusions. And, it’s certainly not a god-like being capable of showering us with scientific ambrosia or building a perfect civilization.  I predict that a society dependent on AI will actually stagnate and remain trapped in stasis, never really inventing anything of much value and never progressing.  It will only ever be concerned with homogenization – The merging of people with the algorithm.  That is where ALL the society’s energies will go.

As a point of reference to why AI is overrated, all we have to do is look at the behavior of AI programs like ChatGPT; the algorithm has been discovered on numerous occasions to contain extreme political biases always leaning to the far-left, including biases based in beliefs not backed in any way by scientific evidence. Interestingly, ChatGPT will even at times display a seemingly hostile response to conservative concepts or inconvenient facts. The bot will then DENY it is giving personal opinions even when its responses are consistently pro-leftist.

How is political bias possible for a piece of software unless it was programmed to display that bias? There is no objectivity to be found in AI, nor any creativity, it will simply regurgitate the personal opinions or biases of the people that created it and that engineered how it processes data.

Unlike a typical human teenager that seeks to adopt the opposing social or political beliefs of their parents in order set themselves apart, AI will never metaphorically dye its hair blue, pierce its nose and proclaim itself vegan – It will always do what its creators want it to do.  Another example of this dynamic is AI art, which essentially steals the stylistic properties of numerous human artists entered into its database and copies them. While imitation might be considered the highest form of flattery, it’s not the same as creativity.

This might not sound like much of a problem when it comes to a simple chatbot or the making of cartoons. But, it’s a massive problem when we start talking about AI influencing social and governmental policies.

The globalists argue that AI will be everywhere – In business, in schools, in corporate operations, in scientific enterprises, and even within government. It MUST run everything. Why? They don’t really say why other than to make vague promises of incredible advancements and previously unimaginable benefits. To date, there have been no profound innovations produced by AI, but I suppose pro-AI propagandists will say that the golden age is “right around the corner.”

The uses for AI are truly limited to helping humans with simple tasks, but there is still a cost. A self driving car might be great for a person that is physically handicapped, but it can also be a crutch that convinces a population to never learn to drive themselves. By extension, AI is in a lot of ways the ULTIMATE crutch which leads to ultimate tyranny. If people are convinced to hand over normal human processes and decision making opportunities to automation, then they have handed over their freedoms in exchange for convenience.

More importantly, if algorithms are allowed to dictate a large portion of choices and conclusions, people will no longer feel a sense of accountability for their actions. Regardless of the consequences, all they have to do for the rest of their lives is tell themselves they were only following the suggestions (or orders) of AI. The AI becomes a form of external collectivized conscience; an artificial moral compass for the hive mind.

But who will really be controlling that moral compass and bottle-necking the decisions of millions of people? Will it be the AI, or the elites behind the curtain that manipulate the algorithm?

For many people this probably sounds like science fiction. Yes, there have been many fictional imaginings of what the world would be like in the shadow of AI – I would highly recommend the French New Wave film ‘Alphaville’ as one of the most accurate predictions on the horrors of AI and technocracy. However, what I am warning about here is not some far off theoretical future, it is already here. Take a look at this disturbing video on AI from the World Government Summit:

These are the blatant goals of globalists in plain view, with a sugar coating to make them more palatable. I wrote about the motivations of the elites and their worshipful reverence for AI in my article ‘Artificial Intelligence: A Secular Look At The Digital Antichrist’. That piece was focused on the philosophical drives that make globalists desire AI.

In this article I want to stress the issue of AI governance and how it might be made to appeal to the masses. In order to achieve the dystopian future the globalists want, they still have to convince a large percentage of the population to applaud it and embrace it.

The comfort of having a system that makes difficult decisions for us is an obvious factor, as mentioned above. But, AI governance is not just about removing choice, it’s also about removing the information we might need to be educated enough to make choices. We saw this recently with the covid pandemic restrictions and the collusion between governments, corporate media and social media. Algorithms were widely used by web media conglomerates from Facebook to YouTube to disrupt the flow of information that might run contrary to the official narrative.

In some cases the censorship targeted people merely asking pertinent questions or fielding alternative theories. In other cases, the censorship outright targeted provably factual data that was contrary to government policies. A multitude of government claims on covid origins, masking, lockdowns and vaccines have been proven false over the past few years, and yet millions of people still blindly believe the original narrative because they were bombarded with it nonstop by the algorithms. They were never exposed to the conflicting information, so they were never able to come to their own conclusions.

Luckily, unlike bots, human intelligence is filled with anomalies – People who act on intuition and skepticism in order to question preconceived or fabricated assertions. The lack of contrary information immediately causes suspicion for many, and this is what authoritarian governments often refuse to grasp.

The great promise globalists hold up in the name of AI is the idea of a purely objective state; a social and governmental system without biases and without emotional content. It’s the notion that society can be run by machine thinking in order to “save human beings from themselves” and their own frailties. It is a false promise, because there will never be such a thing as objective AI, nor any AI that understand the complexities of human psychological development.

Furthermore, the globalist dream of AI is driven not by adventure, but by fear. It’s about the fear of responsibility, the fear of merit, the fear of inferiority, the fear of struggle and the fear of freedom. The greatest accomplishments of mankind are admirable because they are achieved with emotional content, not in spite of it. It is that content that inspires us to delve into the unknown and overcome our fears. AI governance and an AI integrated society would be nothing more than a desperate action to deny the necessity of struggle and the will to overcome.

Globalists are more than happy to offer a way out of the struggle, and they will do it with AI as the face of their benevolence. All you will have to do is trade your freedoms and perhaps your soul in exchange for never having to face the sheer terror of your own quiet thoughts. Some people, sadly, believe this is a fair trade.

The elites will present AI as the great adjudicator, the pure and logical intercessor of the correct path; not just for nations and for populations at large but for each individual life. With the algorithm falsely accepted as infallible and purely unbiased, the elites can then rule the world through their faceless creation without any oversight – For they can then claim that it’s not them making decisions, it’s the AI.  How does one question or even punish an AI for being wrong, or causing disaster? And, if the AI happens to make all its decisions in favor of the globalist agenda, well, that will be treated as merely coincidental.

Original source: https://www.investmentwatchblog.com/governance-by-artificial-intelligencethe-ultimate-unaccountable-tyrannythe-elites-will-present-ai-as-the-great-adjudicator-the-pure-and-logical-intercessor-of-the-correct-path-not-just-for-nations/

Categories
Lifestyle

These Governments are Absolutely Clueless

These Governments are Absolutely Clueless

By BoatSurfer600

They are literally trying their best to lose this economic war with the East.

via brusselstimes

A planned ban on all new combustion engine vehicles in 2035 has formally been approved by representatives of the 27 EU Member States on Monday, with Germany lifting its veto in exchange for exemptions regarding synthetic fuels.

From 2035, new vehicles will no longer be allowed to emit carbon dioxide (CO2). This means that the sale of new petrol, diesel, and hybrid vehicles will effectively be banned, in favour of all-electric vehicles.

Electric Cars Are Bankrupting the Auto Industry…Only a government ban on cars can save them.

Ford reported that it’s going to lose $3 billion on electric cars in 2023.

Unlike most automakers, Ford reports its electric vehicle numbers separately, but experts estimate that most car companies are losing similar amounts on the dead end business.

Ford’s investment in Rivian’s electric cars can’t be helping. Last year the startup electric pickup truck maker was spending $220,000 to make the electric vehicles that it sells for $81,000.

That’s bad news for George Soros and for CalPERS: California’s massive public employees retirement fund and a ticking time bomb which owns hundreds of thousands of shares in Rivian.

GM and Ford both project that their electric cars will be profitable in a few years. Ford plans to make 2 million electric cars every year by 2025. That would be impressive considering that Ford only sold 61,575 of them in 2022. It sold 3,624 electric vehicles in Feb 2023.

That’s a long way from 2 million.

GM plans to sell 1 million electric cars by 2025. It sold less than 40,000 in 2022.

Projections like these might make sense if GM and Ford had hot products and untapped market demand. Instead there are too many electric car models chasing a tiny market. Electric car sales have yet to break the million mark. Most of the electric car activity continues to be concentrated in the luxury SUV market which only has so many buyers able to afford them.

Even the “affordable” electric cars, like GM’s Bolt, start at $30,000, and lose as much as $9,000 for the company.

The only way to create demand for electric cars is through government mandates.

After 2035, if you want to buy a new car in California, it’s electric cars or it’s nothing. California’s mandates that fined car manufacturers, forcing them to buy credits from electric car makers like Tesla, financed the electric car industry. By 2035, California will simply eliminate the competition.

New York, New Jersey, Oregon and Washington have also moved to ban the sale of new cars. About a dozen Democrat states have similarly decided to prevent residents from buying cars. Virginia’s House voted to drop its car ban, but the state’s Senate Democrats have kept it in place. Biden has proposed a similar ban nationwide following its adoption by the EU.

By 2040, GM expects to stop making and selling cars on the assumption of such a ban.

George Soros has reportedly lost over $1 billion with his Rivian investment, and his other electric car investments may seem shaky, but in the long term the leftist politicians he has backed are expected to eliminate the competition and clear cars off the roads and highways.

Automakers are spending billions to build electric cars that no one wants and no one can afford because governments have assured them of a captive market. And after all that money flushed down the drain, their lobbyists are aggressively pressuring legislators to impose new bans and keep the existing bans in place. They’ve also been seduced with the promise of subsidies and tax credits that will free them from the pedestrian business of actually turning a profit.

Interesting China, Russia , Saudi Arabia, Iran joint financial war against the USA

Original source: https://www.investmentwatchblog.com/these-governments-are-absolutely-clueless/ 

Categories
Lifestyle

The Reckless Printing of MONEY and LIES is Finally Approaching an End

The Reckless Printing of MONEY and LIES is Finally Approaching an End

By Health Ranger Report

0:00 Intro

1:11 Headlines

20:41 Interview with Bob Moriarty

1:08:17 Interview with Ty Bollinger

– Norway military munitions manufacturer can’t expand due to lack of power in Europe

– Mainstream media admits Ukraine is running out of ammunition

– Western countries can print CURRENCY and print LIES but they can’t print artillery shells

– Italy bans insects in pasta and pizza

– JP Morgan pushing facial scans and palm scans for payment systems (Mark of the Beast)

– Government ramps up attacks on #crypto in preparation for CBDC rollout

– Farmer protests spread in Slovenia as fascist governments declare war on agriculture

– CFTC levels charges against Binance but ignores dollar banking system crimes

– Interview with Bob Moriarty about western financial system collapse

– Interview with Ty Bollinger about accelerated cancer rates following vax/bioweapons

Here’s what others had to say:

Splish_Splash
Michael you said it is common sense to know that the elite want to kill us – it is to me, although it is STILL HARD TO COMPREHEND AND BELIEVE, – YOU SAID YOU THINK MOST PEOPLE KNOW THAT NOW – N O . . T H E Y . . . D O . .
N O T. Almost all my friends and all my family got the jabs and the boosters they still think it was a great thing do do – I know in the next couple of years they will be D E A D ! One Air Force buddy from 53 yrss ago who was so pro vaccine – he is now dying of panreatic cance and brain cancer and liver cancer – he will never understand he killed himself I know that. I suspect he will be gone by Easter. I mention to friends about prepping getting food – THEY JUST CAN’T SEE IT.,NONE OF THESE EOPLE LIVE WITHIN 500 MILES OF ME FORTUNATELY! i DON’T HAVE DEAL WITH THEIR INABILITY TO LOOK AHEAD. YES, i KNOW THEY WILL ALL BE GONE IN THE NEXT FE – I KNOW!

4CathyG
There are people all over the world in the streets protesting and standing up for what they believe in… Yet the supposed “freest Nation” in the world…people are silent…🙄…What have they done to us??????

Splish_Splash
Well, Michael the end of your interview with Bob Moriarty is one of those times I have mentioned before that cause me to weep not in a bad way at all! But because, I am so glad I found you, 1st of all. 2nd there are times I feel so privileged to get to listen to you and your guests and when I hear the mutual admiration – I just simply break down; and lastly, I am so grateful to the Creator God of the universe for the resources He has hooked me up with for these last days and certainly the last days of my life on this planet though if I live as long as my mom did I would still have another 20 yrs she was 98. It is such a deep gratitude to the Lord. THANKS MICHAEL sure wish you were my son, or at least my favorite nephew!

Nata
Bob Moriarty is so wise. Got a talent, gotta use it to help the world. Mike, you and all of the other people in this movement are such amazing examples of that and of not giving up. Inspires me to be better or at least to get my sh*t together. So grateful for that.

Timber McKinney
Great Interview with Mr. Moriarty! There is a great deal or admiration and respect for one another! Because of the last interview with Mr. Moriarity and me being an avid aviation enthusiast I bought the book “No Guts No Glory “! It was a fantastic read! Thank You both for your wisdom and great stories!

Rist Rocket
Russian leadership has analyzed the way the Ukrainian battles are consuming arms supplies along with the future of Russian border defense and have determined production should be increased by a factor of seven to eight by the end of this year. Today, artillery shells are being supplied about 145,000 rounds a month. These increases artillery to a million rounds per month. This along with with the hardware which uses these shells. New tanks are coming at one per day right now. As Russia is primarily involved in security of its borders with a very wide DMZ line around those boarders, Russia believes it may be forced into border wars for years. This is why Russia is greatly expanding personnel and equipment being ready to fight everything the West can through at Russia from any direction. Of course, any aggression to Russia from the West is simply outright insanity as Russia is a self sufficient country in terms of resource materials and industrial manufacturing. To add to that Russia and China now have trading partnership to underpin each others areas lacking manufacturing capabilities and food supplies. With Russia and China with their business partners is this two billion people working toward common goals of peace and prosperity? India is part of BRICS also so three billion people. The crazed West do not have a fricking chance to defeat this juggernaut of peace and trade.

Jarumir Khan
The process of mass Conditioning is the very important point, neurologically (physis and bios) and of course from psyche and pneuma. I think, the dark forces can do that with the new technologies in real time wth G5 and other tecs. and they behave like robots. I am an real expert and studying that on universities and in real life. Its so horrifying what is happening in that moment, or since 3 Years.

Original source: https://www.brighteon.com/e287f246-51e5-4349-a2b0-1080a8964974

Categories
Cryptocurrency

BRICSTether Launches on Azbit Exchange as an Alternative to USDT and the USD, Pegged to 7 Chinese Yuan ($1 USD) & Offering 10% PA

BRICSTether Launches on Azbit Exchange as an Alternative to USDT and the USD, Pegged to 7 Chinese Yuan ($1 USD) & Offering 10% PA

By CRYPTO PROMOTER

Introducing BRICST: A stablecoin to be an alternative to the USD and USDT, and pegged to the Chinese Yuan, offering 10% per annum returns.

What is BRICST?
BRICST is a cryptocurrency that aims to provide a stable and secure platform for transactions and investments in the BRICS region and beyond. BRICST is designed to solve the problems of volatility and instability that have plagued the cryptocurrency market since its inception.

1 BRICST = 7 Chinese Yuan.

BRICSTether Custodian, agrees to buy back any BRICSTether at 100% of its pegged price of 7 Chinese Yuan (approximately $1 USD currently)

It lists shortly on Azbit.com Exchange before launching on further exchanges afterwards, and you can purchase with crypto on Azbit.It’s paired with Bitcoin BTC.

Earn By Staking.
With our innovative staking program, you can earn interest on your coins simply by holding them. That’s right, you can earn up to 5% interest for staking your coins for just 90 days or earn a whopping 10% for 12 months! And this is just the beginning – we’re always looking for ways to reward our loyal holders and provide even more benefits.

BRICST INVESTS IN ASSETS!
At BRICST, we invest in a range of assets to create a stable and profitable portfolio. Our investment strategy includes the following:

Liquid assets.
Stocks
Gold and Silver commodities.
Crypto assets.
Real Estate.
BRICS Plus nations’ investment opportunities.
With this diversified approach, we aim to deliver strong returns and maximize growth potential.

*The % held in each asset allocation will vary subject to investment management decisions deemed appropriate for the best asset protection and liquidity requirements of the currency*

HOW TO BUY BRICST.
Buying BRICST is easy and straightforward. Here are the steps:

Step 1: Create a digital wallet that supports BRICST (preferably BRICSTX). You can use any of the popular wallets like MyEtherWallet, MetaMask, Trust Wallet, or BRICSTX. We recommend you use BRICSTX.

Step 2: Purchase Ethereum (ETH), Bitcoin (BTC), USDT, or USDC from any exchange that supports your local currency.

Step 3: Send your ETH or BTC to your digital wallet and exchange it for BRICST.

Step 4: Once you have purchased BRICST, you can store it in your digital wallet or use it for transactions and investments.

For the best experience, visit BRICSTX exchange and buy BRICST hassle-free with crypto or fiat currency.

Here’s what others had to say:

OYUN ZAMANI
Such a good feeling about this project

Muhammed Ataş
This project is really good

İbrahim Süleymanov
Great coin.

Original source: https://youtu.be/0vrZPoPx07k

"All In" Starter Package


The Fast Start


Level 2️⃣


Level 1️⃣


Level 4️⃣ (5000 USD)


Level 3️⃣ (1500 USD)